Part 4: Monitoring the Demo Network Environment with nmaas
Registering a new Local nmaas User
Registering a new local nmaas user can be done from the nmaas homepage.
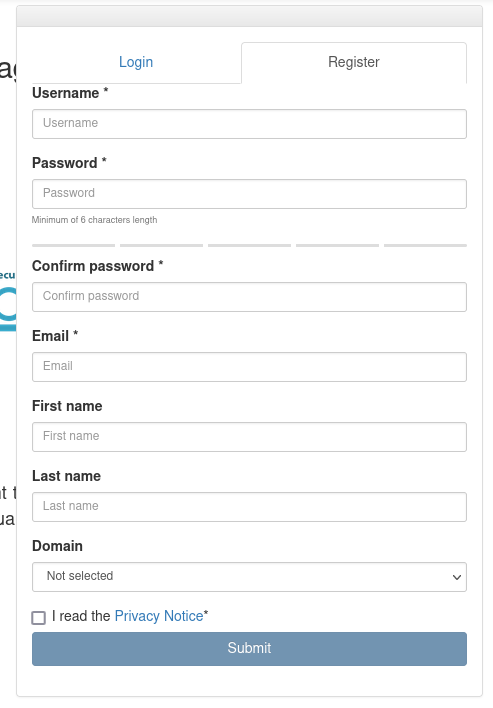
Once all of the required fields (denoted by a red *) are filled, and the privacy policy accepted, the registration form can be submitted.
After submission, an administrator approval is required before being able to login.
Approving the New User (as Admin) and Creating a New Domain
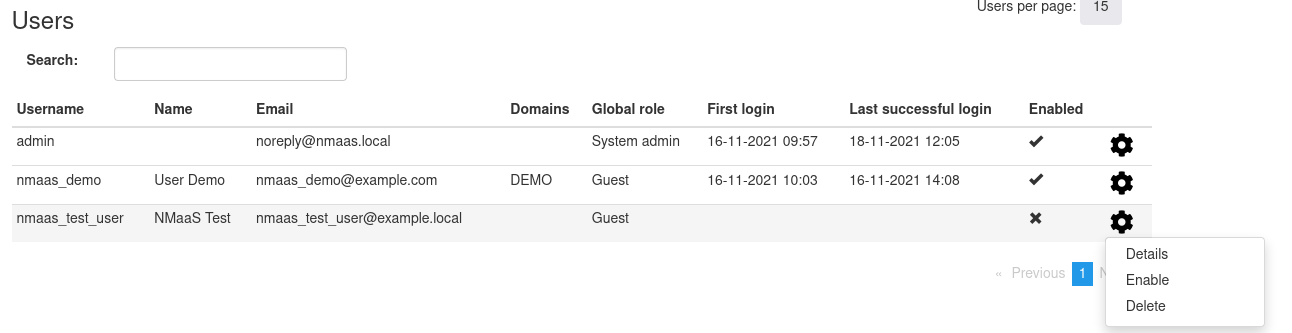
To approve a newly registered user, login as the nmaas admin, and navigate to Settings -> Users from the right-hand side navigation menu. Hover over the cog next to the new user and select Enable.
Once enabled, the user should be made part of an existing domain. Since we currently have not configured any domains, a new one needs to be created.
- Navigate to
Settings -> Domainsfrom the right-hand side navigation menu. - Click the blue
Add domainbutton - Enter a descriptive name for the domain, as well as a short codename. Please keep the codename as short as possible, since it will be embedded in all customer deployed Kubernetes resources.
-
Choose which Kubernetes namespace will be dedicated to hosting the customer deployed applications. A new namespace can be created by executing:
-
For a local deployment, leave the Kubernetes storage class field empty, and set Kubernetes Ingress class to the ingress class available in the cluster (public for MicroK8s, nginx for K3s)
- As External service domain set the domain codename, suffixed by the nmaas URL. For example, if the domain codename is demo, then External service domain should be set to
demo.nmaas.<INGRESS_LB_IP>.nip.io. - Set the DCN deployment type to
Manualand tickDCN Configured. -
Set a dummy customer network, for example
127.0.0.1/24.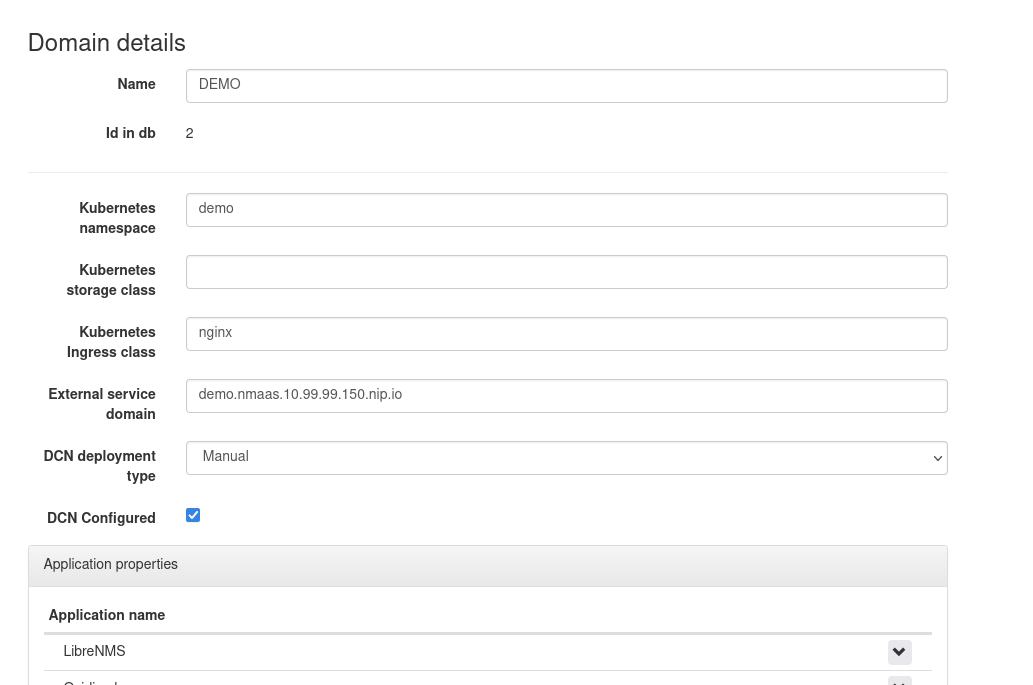
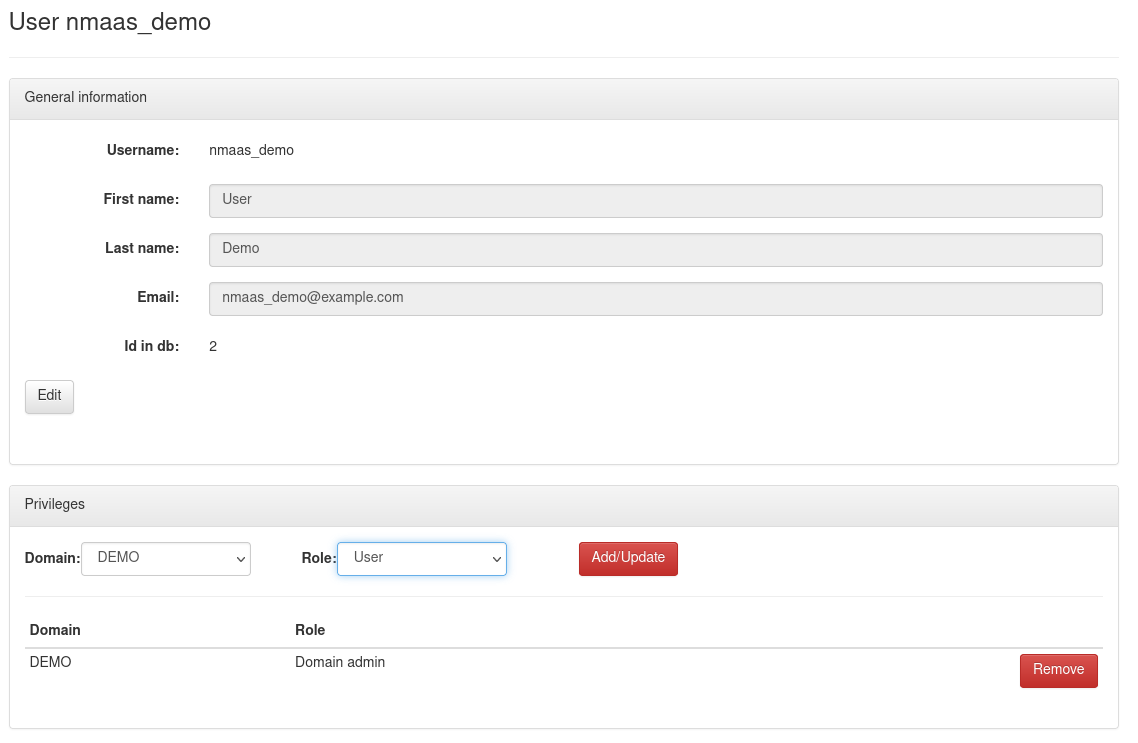
Once created, any existing user can be made part of the domain. Return to Settings -> Users and choose the Details option after hovering over the cog for the new user. In the Privileges section, assign the role Domain admin to the newly created user.
Adding a Personal SSH Public Key
After the user has been approved, if email sending has been successfully configured, the user should receive a confirmation message.
During the first login, the user will be asked to enter an SSH public key which will be used for access to the GitLab repositories hosting the deployed applications' configuration files. An SSH key can also be specified at any later point in time from the Profile -> SSH keys section.
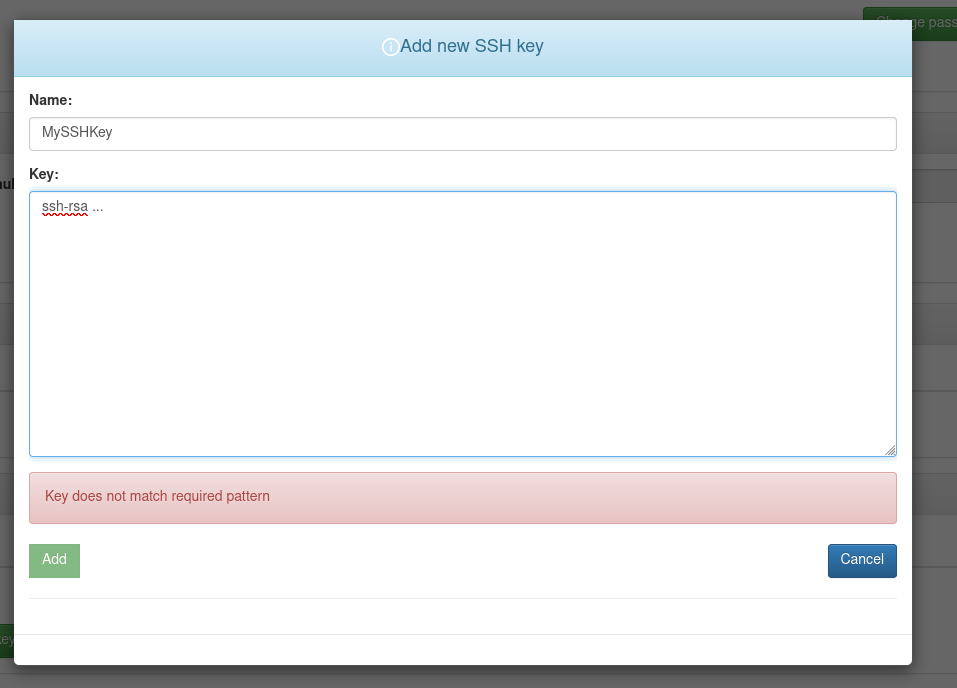
Please add an SSH public key before proceeding to the next section, Application Deployment.
Application Deployment
The application deployment process is consisted of two parts:
-
Subscribing to the desired application from the list of all applications.
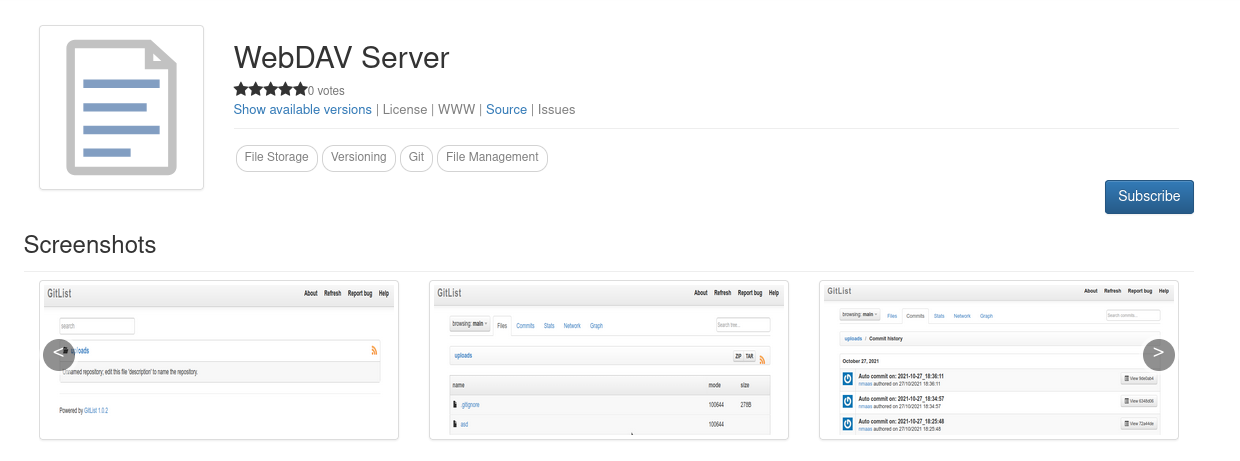
-
Deploying an instance of the application from the Subscriptions page.
Deploying Prometheus
Prometheus is a monitoring application which uses the pull methodology to fetch metrics from a given device.
To deploy Prometheus, first subscribe to it from the Applications section. Then choose the Deploy option.
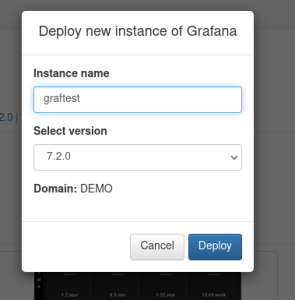
On the first pop-up, an option is presented to enter a unique instance name, as well as select the desired application version.
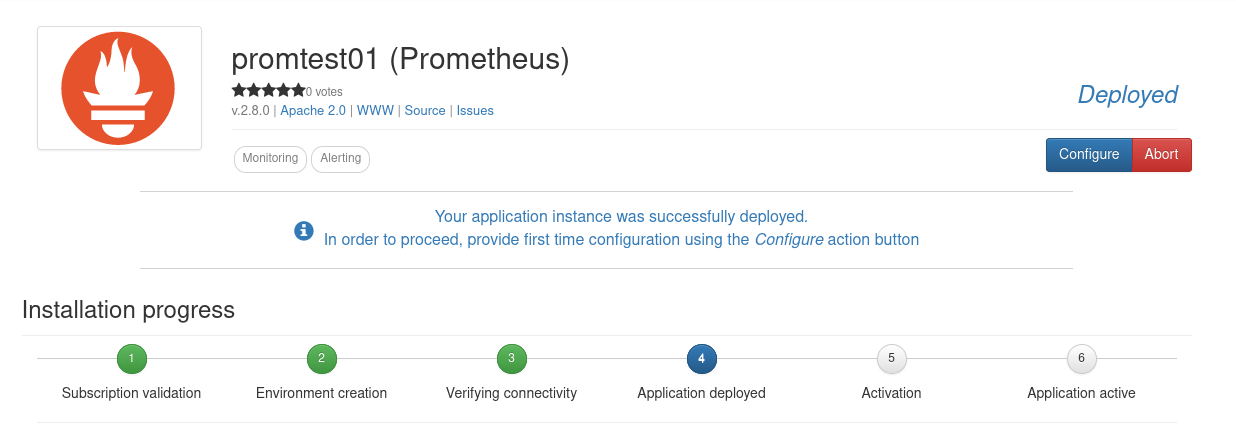
The deployment process consists of 6 different steps, but only step 4, Application deployed, requires user interaction. Once step 4 has been reached, a blue Configure button will appear.
Clicking on this blue Configure button will present a configuration wizard, where additional parameters can be set.
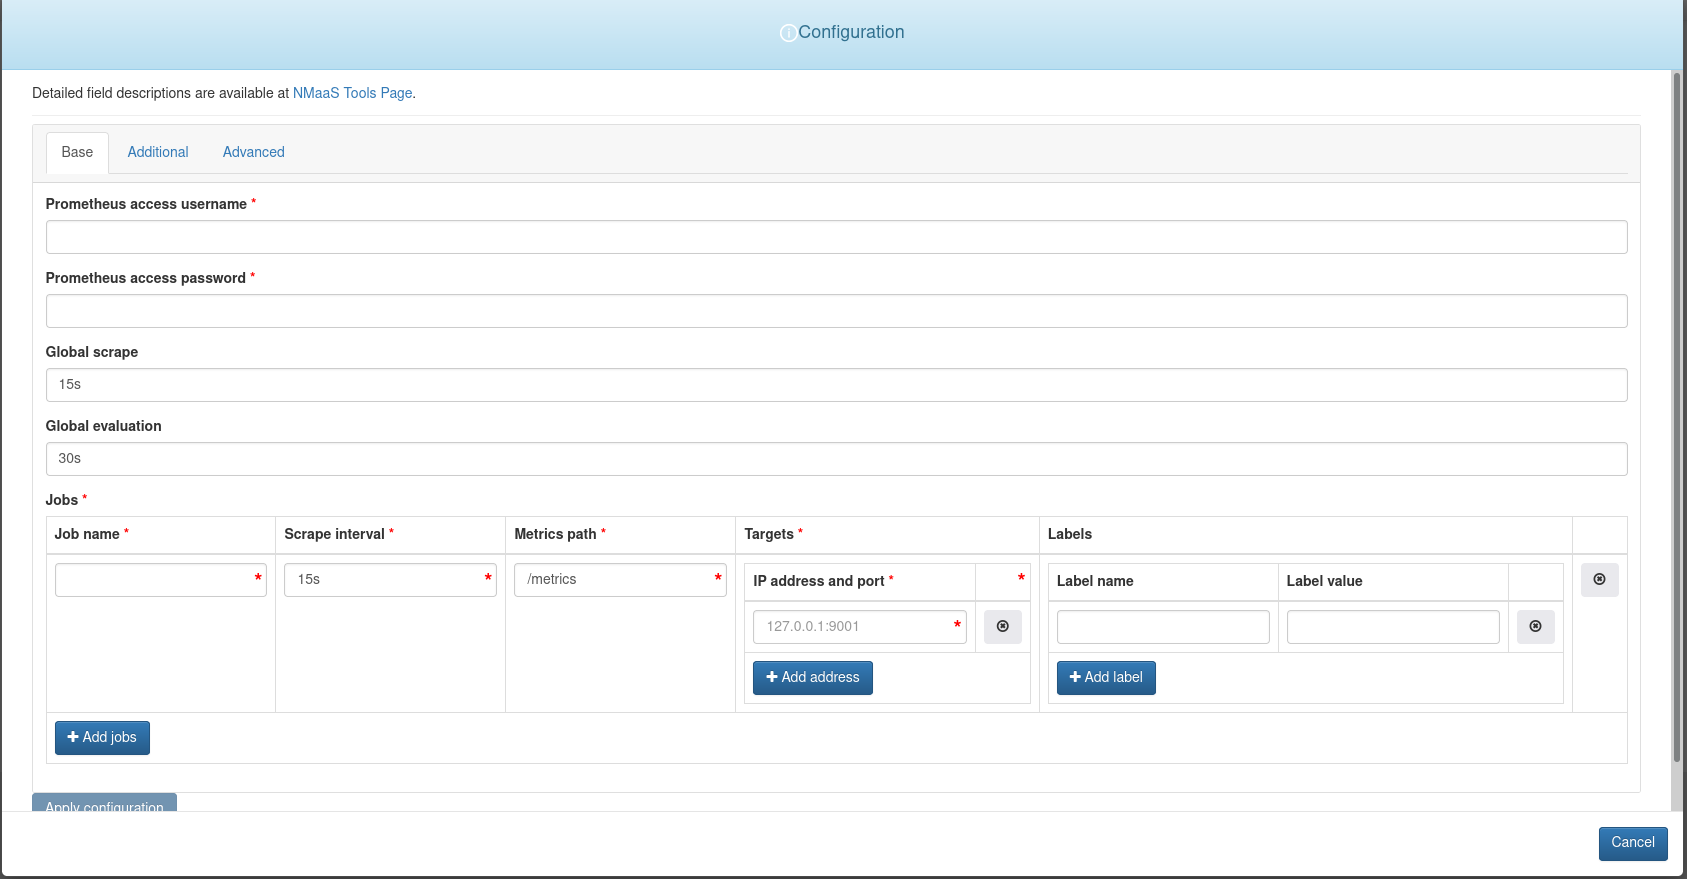
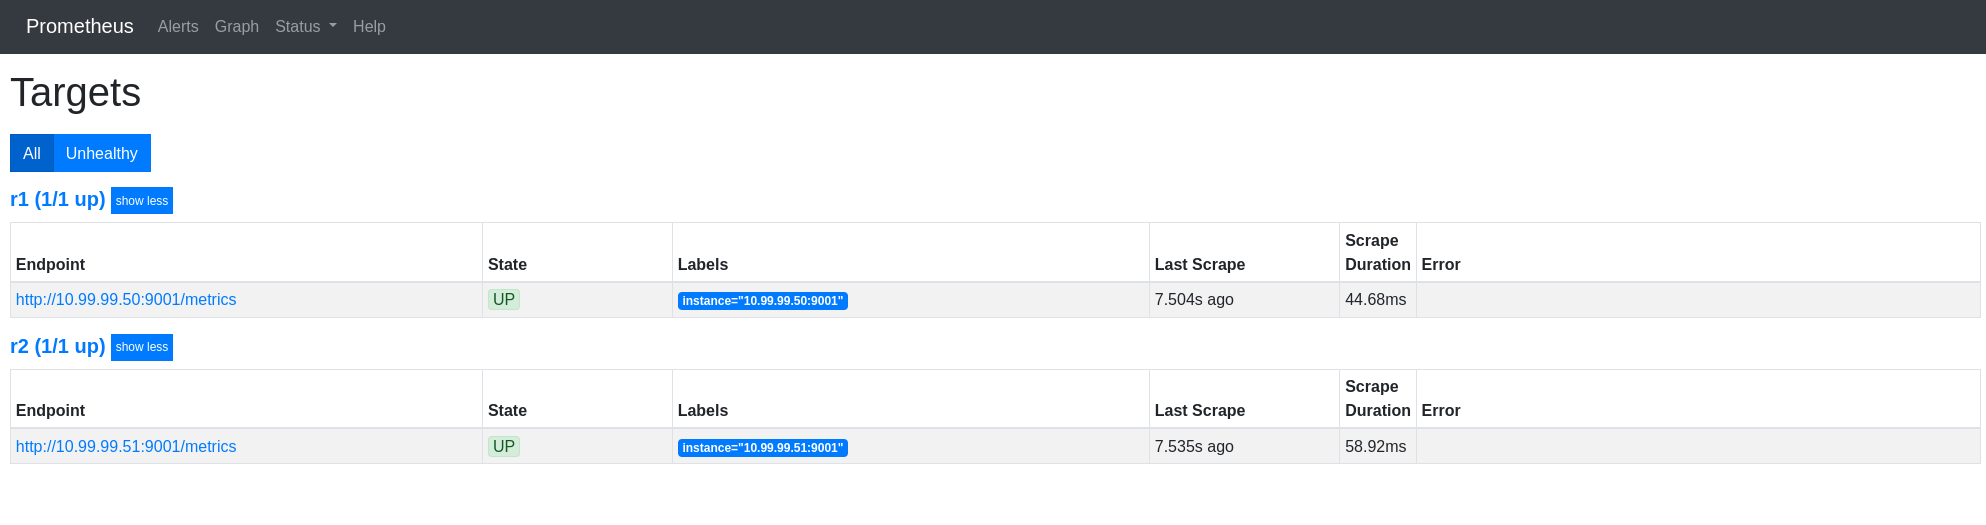
The configuration wizard is specific to the application being deployed. In the case of Prometheus, there is an option to configure the HTTP Basic authentication username and password, as well as the scrape interval. The IP addresses of the devices that need to be monitored can be specified in the Jobs array. Note that the demo networking devices deployed in the previous step can also be monitored. They have a Prometheus exporter running on port 9001, reachable without any authentication. Additional devices can be added after the application has been deployed by using the Git repository which will host the configuration.
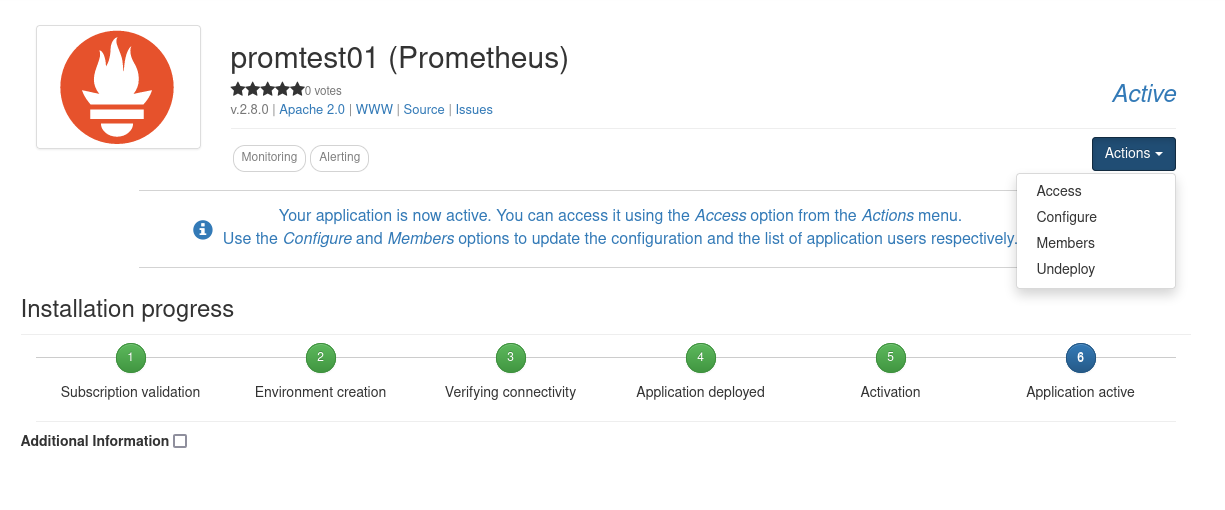
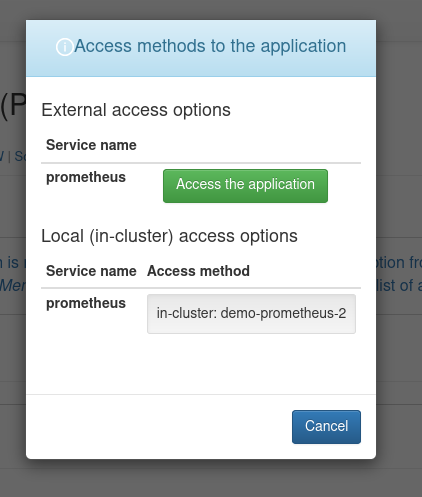
After the application is successfully deployed, it will transition to an Active state, and a blue Actions button will become available. By selecting the Access option in this dropdown menu, the user will be immediately redirected to the Prometheus home page.
Deploying Grafana
By now we have configured Prometheus to monitor the devices in our environment, but we still do not have a way to visualize the gathered metrics.
Grafana is an open-source application that can generate graphs from different data sources, including Prometheus.
To deploy Grafana in an nmaas environment, the same general steps can be used as before:
- subscribing to the Grafana application from the Applications page
- creating a new instance from the Subscriptions page
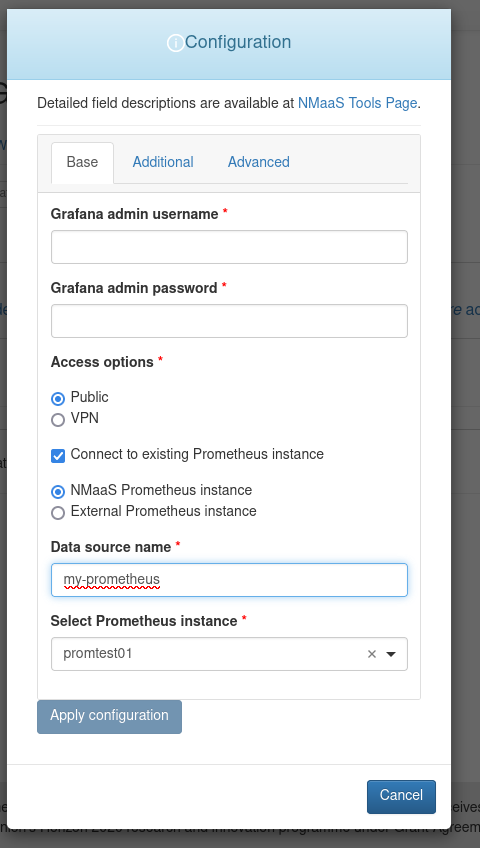
The configuration wizard that becomes available once the deployment enters the Deployed phase is different in the case of Grafana. Apart from specifying the Grafana username and password that can be used for accessing the web interface, users have the option of directly choosing an existing Prometheus instance that has been deployed within their nmaas domain, and adding it as a data source to Grafana. This can be accomplished by ticking the Connect to existing Prometheus instance checkbox, and selecting the nmaas Prometheus Instance radio button.
Of course, a Grafana instance hosted on nmaas can be used for connecting to external data sources as well. In this case, the checkbox Connect to existing Prometheus instance can simply be left unchecked.
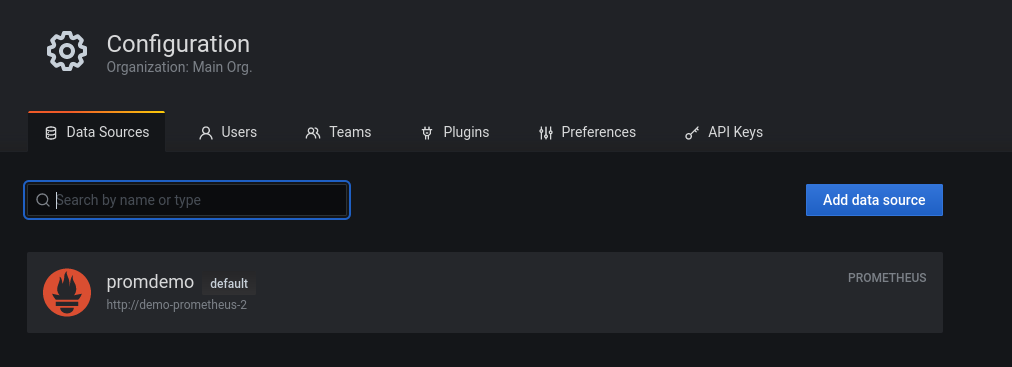
Once the application is deployed, it can be accessed by selecting the Actions -> Access button. After login, users can verify that the previously deployed Prometheus instance has been added as a Data Source by selecting the cog icon on the left hand side and choosing Data Sources.
At this point, new dashboards can either be created from scratch, or imported from the Grafana dashboard gallery.
For example, if the freeRTR virtual instances are deployed, the following two dashboards can be imported to visualize the packet and input/output rates of the devices:
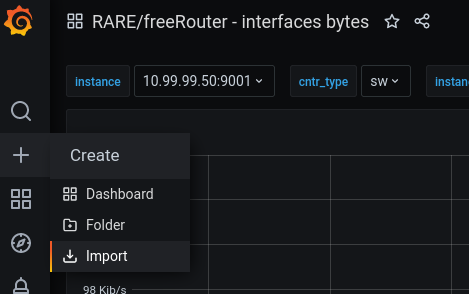
An existing dashboard can be imported into Grafana by simply choosing the Plus button on the left-hand side and selecting Import.
Either a JSON document describing the parameters of the dashboard can be pasted or just the dashboard ID, as shown on the official Grafana page.
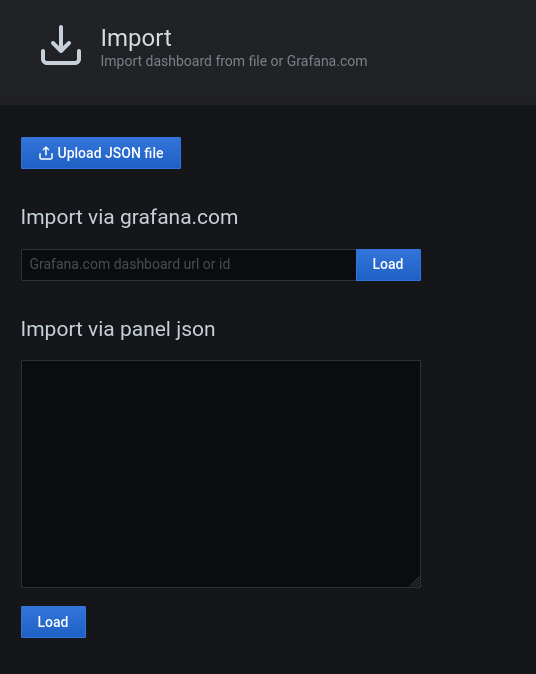
In our case, the IDs for the two previously mentioned dashboards are 13152 and 13153, respectively. This information is also directly visible in their URL.
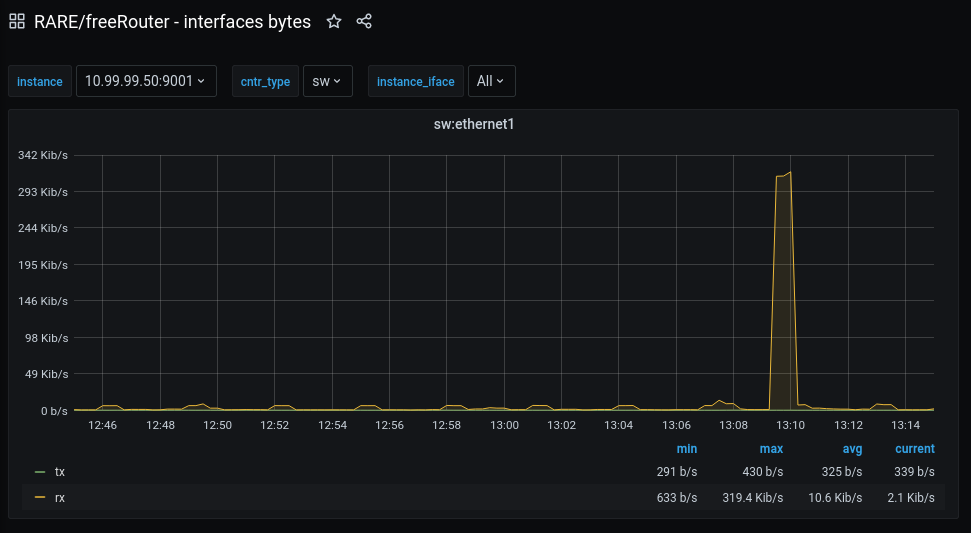
After importing the dashboard, a redirect is immediately issued, and the defined graphs are shown.
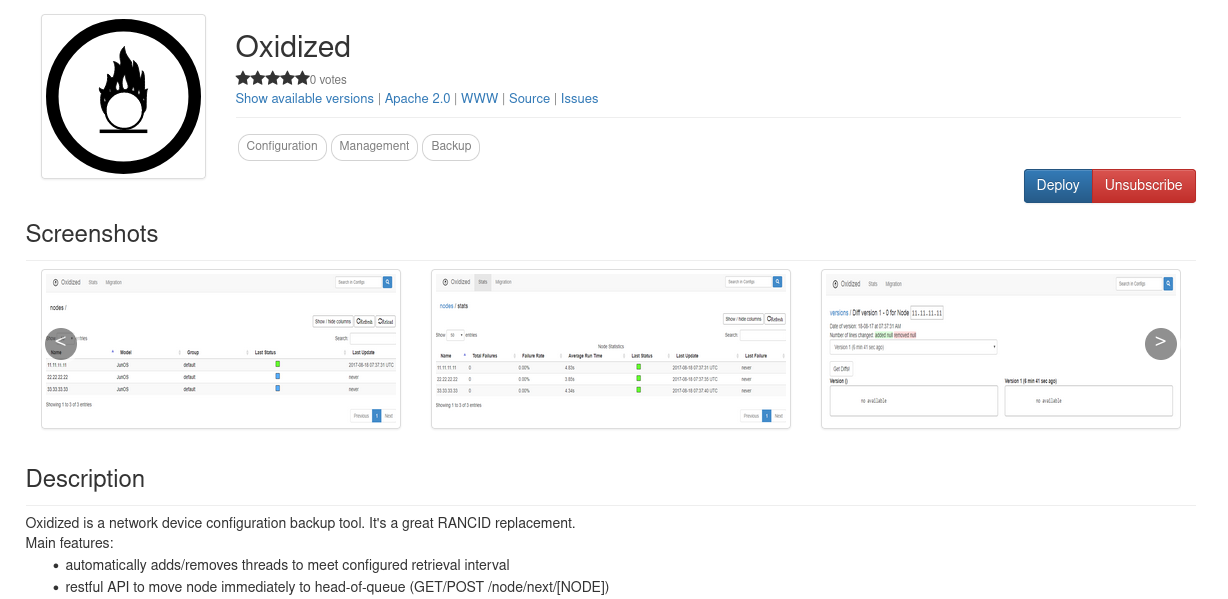
Deploying Oxidized
Oxidized is an open-source application that is capable of fetching the configuration of remote devices and if enabled, version it using an internal or external Git repository.
In our demo scenario, we will use Oxidized to periodically fetch the configuration from the available network elements. To do so, we must first deploy Oxidized in our nmaas domain.
The deployment steps for Oxidized are very similar to the other applications that have been deployed so far:
- Subscribe to the Oxidized application from the
Applicationspage. - Deploy an Oxidized instance from the
Subscriptionspage.
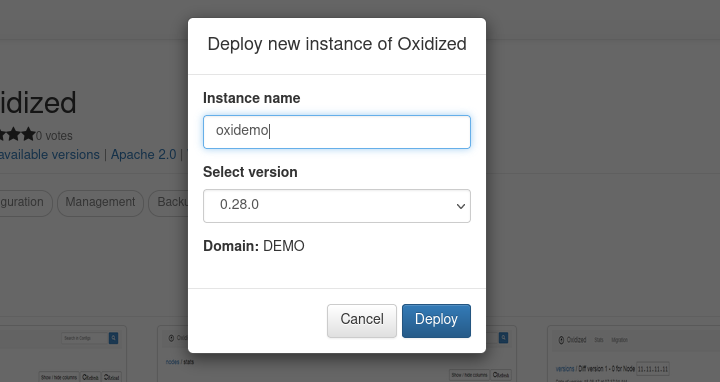
Once the Deploy button is clicked, a pop-up similar as before appears, where an instance name should be provided, and the desired Oxidized version selected.
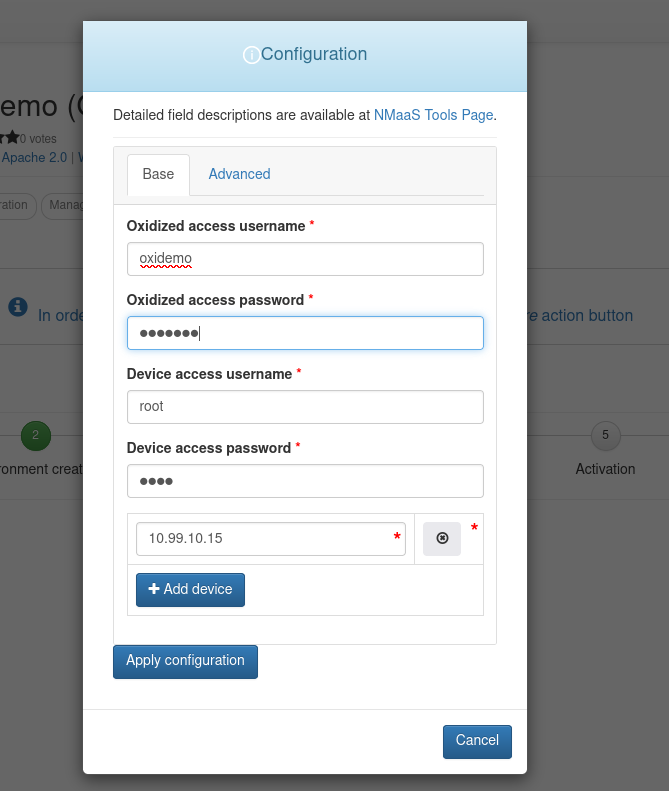
Since Oxidized can connect to devices using a remote access protocol such as Telnet or SSH, the configuration wizard asks for IP information. Additionally, HTTP Basic authentication can also be configured to better secure the Oxidized web interface, using the Oxidized access username and Oxidized access password fields.
Once deployed, the web interface becomes immediately accessible, simply by choosing the blue Actions button and selecting Access.
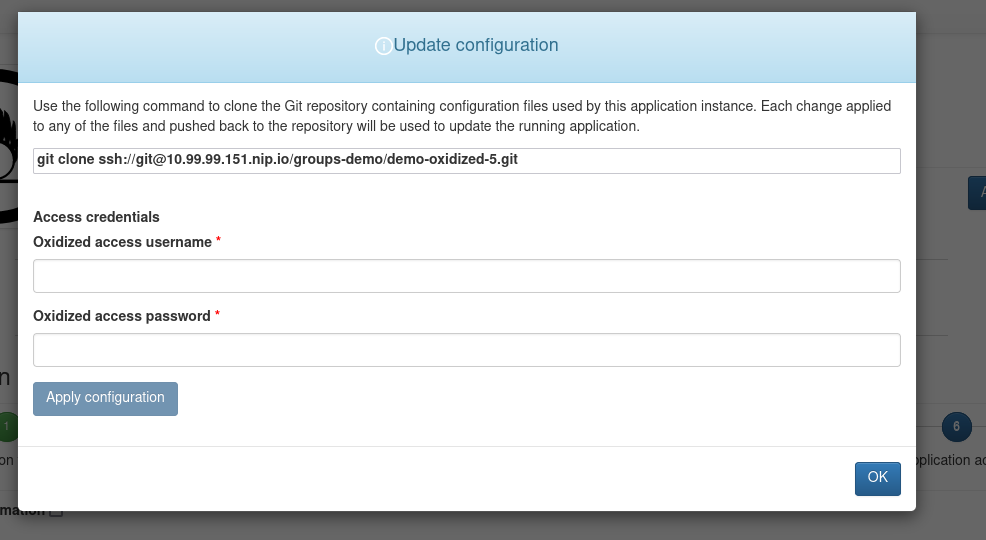
Additional Oxidized configuration, such as altering the list of monitored devices or even adding custom Oxidized models can be done using Git. During the deployment process, a new GitLab repository has been automatically created which hosts the Oxidized configuration data. To access it, select Actions -> Configure and copy the git clone command.
After cloning this repository, two folders should appear: base and model.
The base folder houses basic configuration about the monitored devices:
router.db– hostnames, IP addresses, and groups for the devicesconfig– storage backend, backup storage location, credentials...
The model folder houses specific device models, which describe how Oxidized should connect to the monitored devices and what commands to execute in order to acquire the running configuration.
The RARE team has created a custom Oxidized model which allows configuration fetching from FreeRTR devices. If you have configured freeRTR as part of this tutorial, then this model is required for successful connections towards the freeRTR instances.
Monitoring freeRTR Devices with Oxidized
After cloning the repository, navigate to the model folder and create the file rare.rb wth the following content:
After adding the model, it must also be referenced in the base/config file, where the format of the router.db file can be altered as well.
| config | |
|---|---|
| |
Note that we have altered the keys: model, source.csv.map and model_map.
By altering the source.csv.map object we can set the format of the CSV file that contains the device information. In this case, we will format our CSV file using three columns: name; ip; model.
Finally, alter the base/router.db file to reflect the changes made to the CSV format:
The second column, the IP addresses, should be replaced with the IP addresses of your virtual freeRTR devices.
The final step is to simply commit the changes that have been made. If this is the first time that Git is used, then the global Git user.name and email should be set:
|
Any value can be used for these parameters, they are not related to nmaas.
The changes can be committed and pushed to the remote repository using:
After the push is made, the Oxidized container will be rebooted to apply the changes.
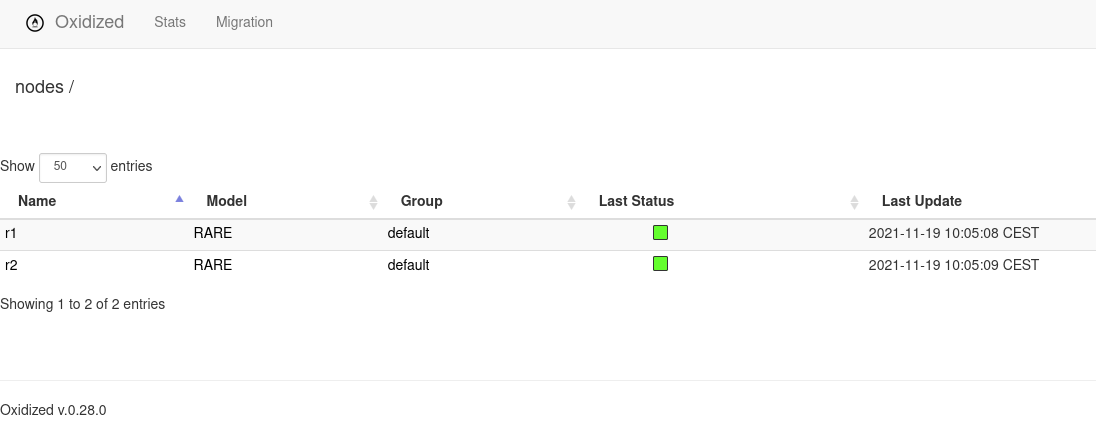
To verify the configuration changes that were made, the Oxidized web interface can be visited. It should show green boxes under Last Status for all devices. This means that the last attempt to fetch the configuration data has been successful.
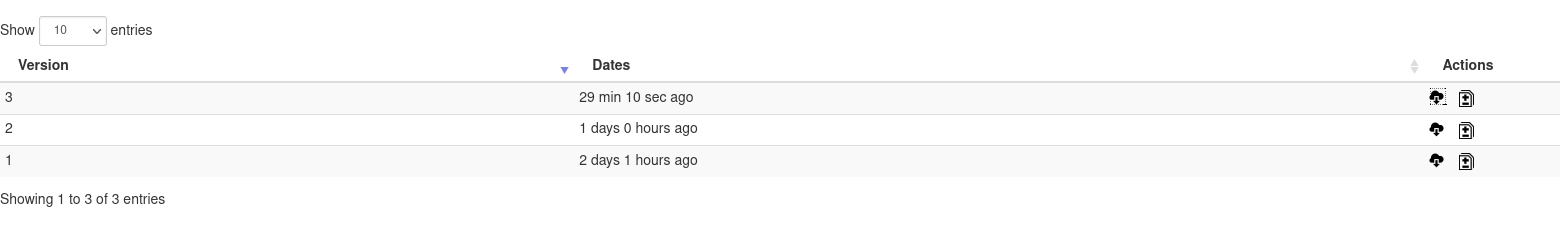
A complete version history can be obtained by using the versions option from the Actions column.
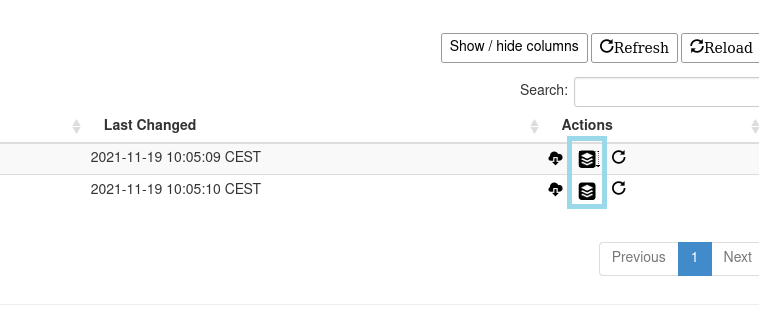
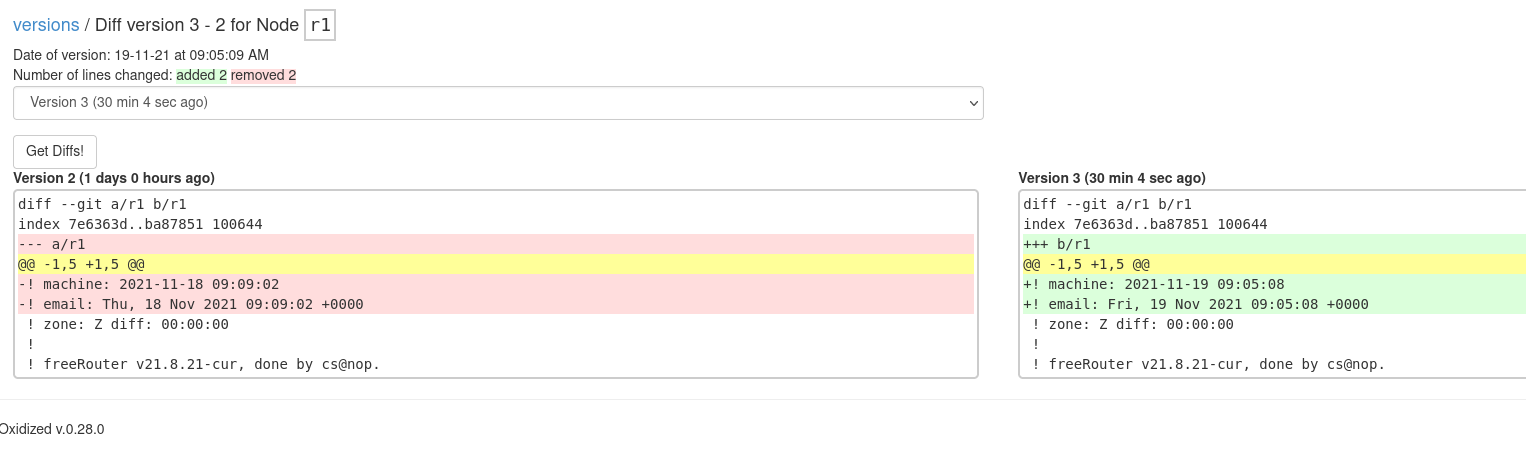
On the Versions page there is an option to download a given configuration archive or create a diff.