[ #004 ] NMaaS-101 - "Prometheus"
In article #001 and #002 you essentially created a NMaaS domain and enabled connectivity between your dedicated and isolated domain to your out of band management equipment network.
Requirements
Overview
In this post, we are going to deploy an interesting and popular Metric collector in the micro-service world: Prometheus. For those who would like an introduction to Prometheus, please refer to this post from the RARE project blog.
Article objective
This is done in 2 steps:
- Prometheus application deployment via the NMaaS portal
- Prometheus configuration specific to RARE domain
Diagram
NMaaS portal: Oxidized
[#003] - Cookbook
Prometheus application deployment
- Once your domain is created and associated to your account, log into https://nmaas.eu as in #001
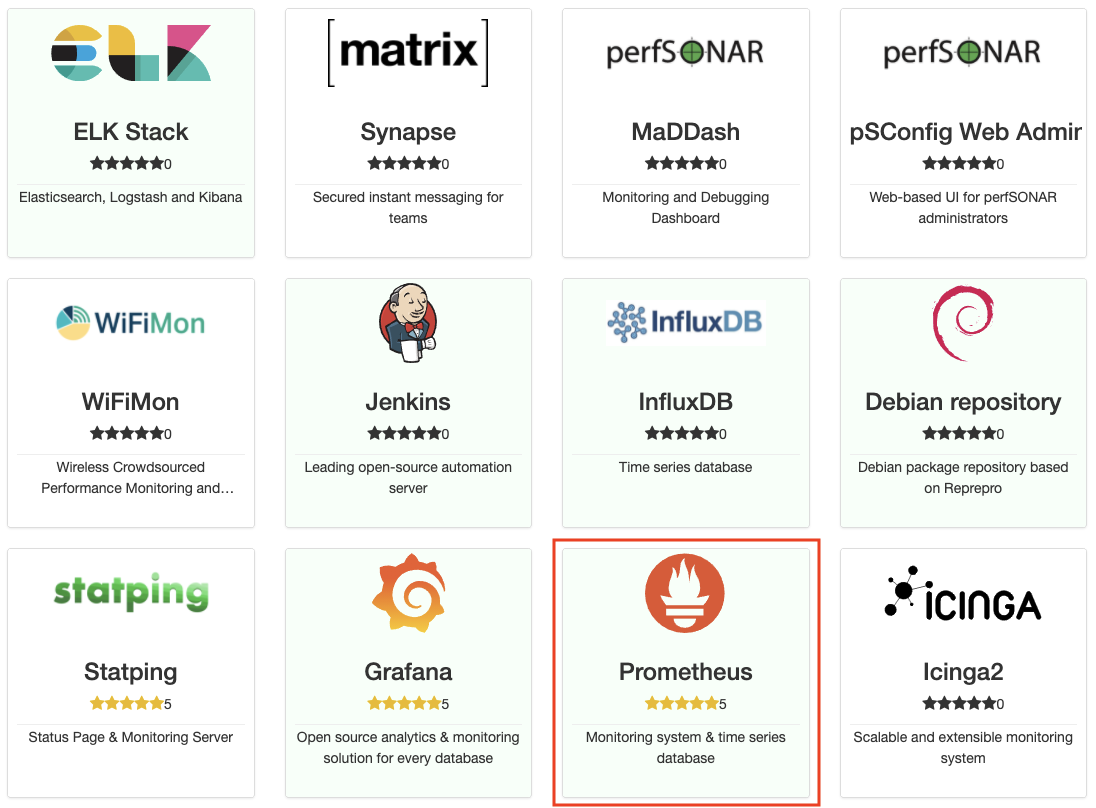
- select Prometheus application
- select "Deploy"
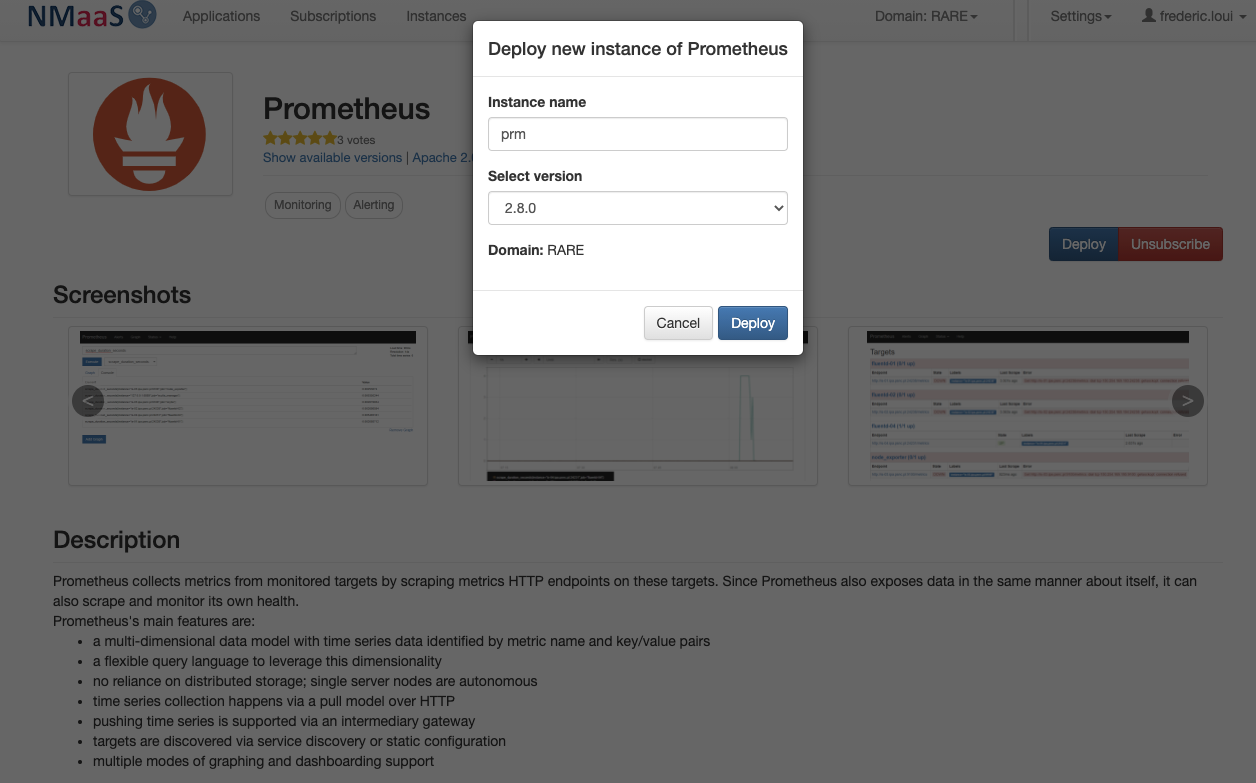
- choose a name for your service instance, in our case we chose: "prm"
The name has a particular importance as it will dynamically create a FQDN for the NMaaS service in the form: <service_name>.<domain>.nmaas.eu In my example it is: prm.rare.nmaas.eu
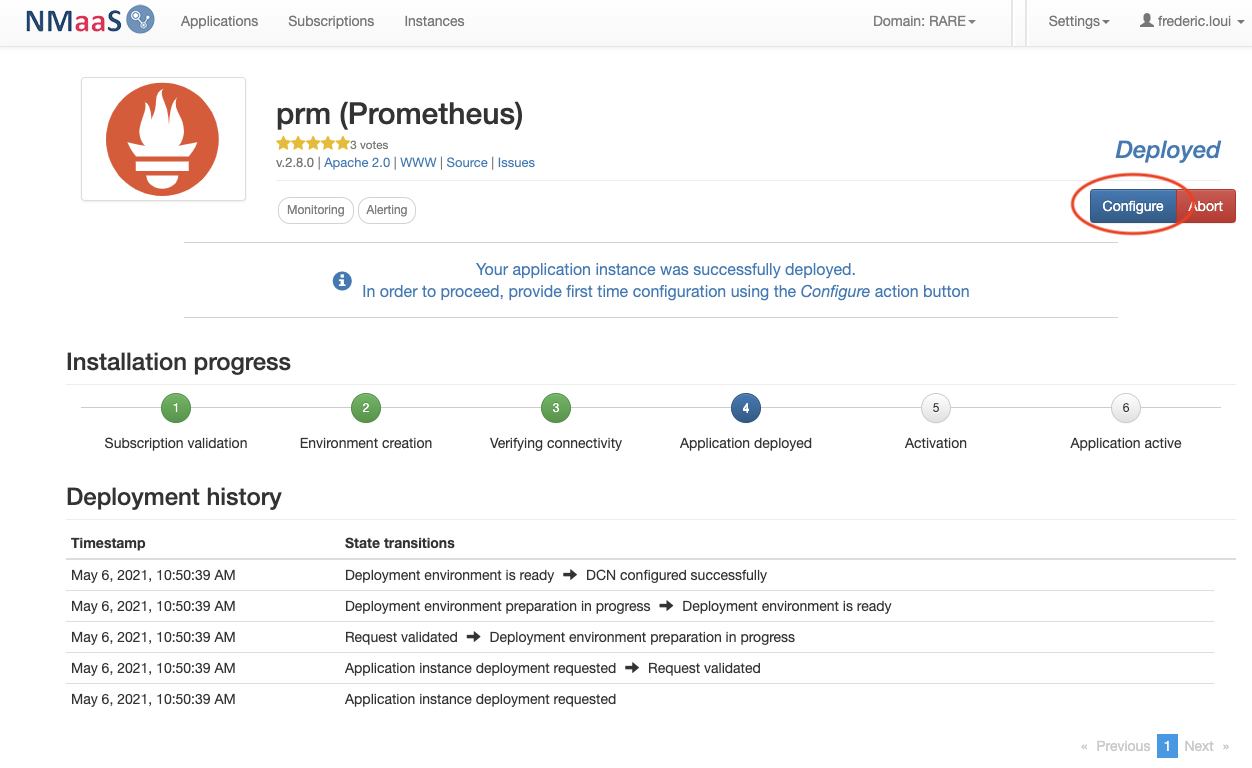
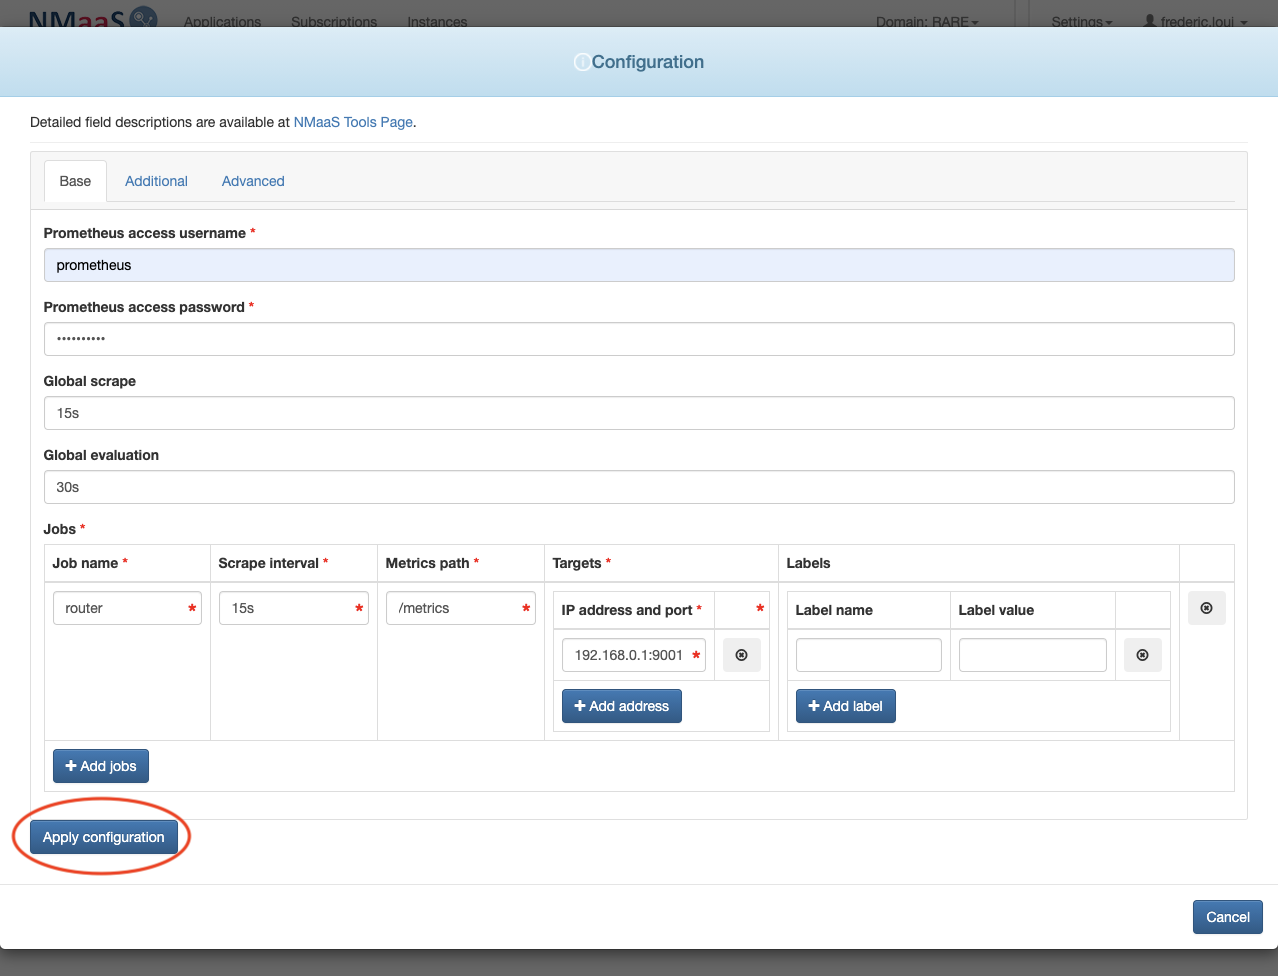
- Click on configure (blue bottom on the lefthand side) information
-
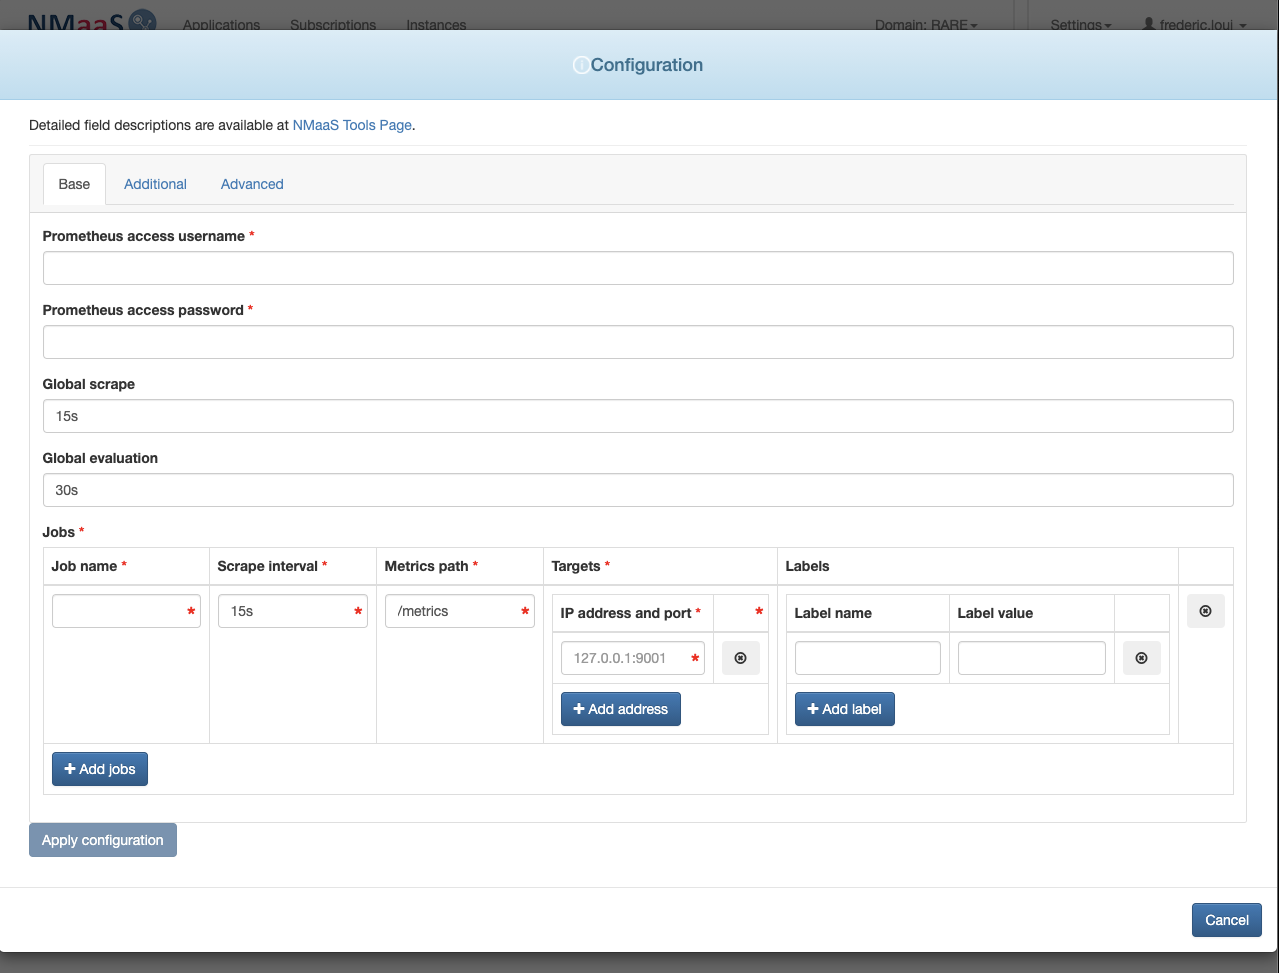
Prometheus access username
we chose: prometheus
-
Prometheus access password
we chose: prometheus
-
Global scrape
As per RARE blog article: 15s
-
Global evaluation
As per RARE blog article: 30s
-
Jobs
Job name: router
-
Device (IP address)
we chose: 192.168.0.1:9001
- Apply configuration
VPN Connectivity Warning
It is important to note that you'll be connected inside a dedicated VPN so you'll be isolated from the outside world as if you were running your own Out of band management network. So we can assume that your domain is secured.
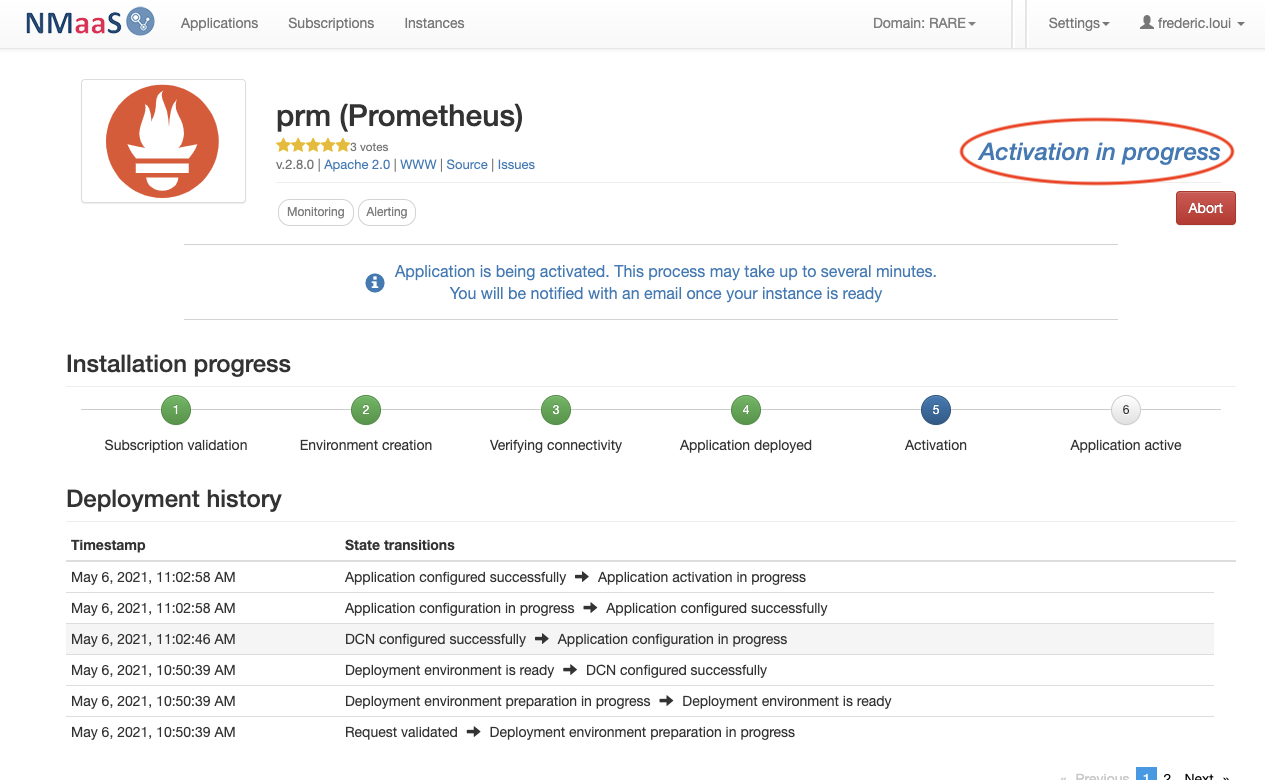
- Prometheus micro-service status will be update to "Activation in progress"
- After few minutes the deployment status will be set to "Active"
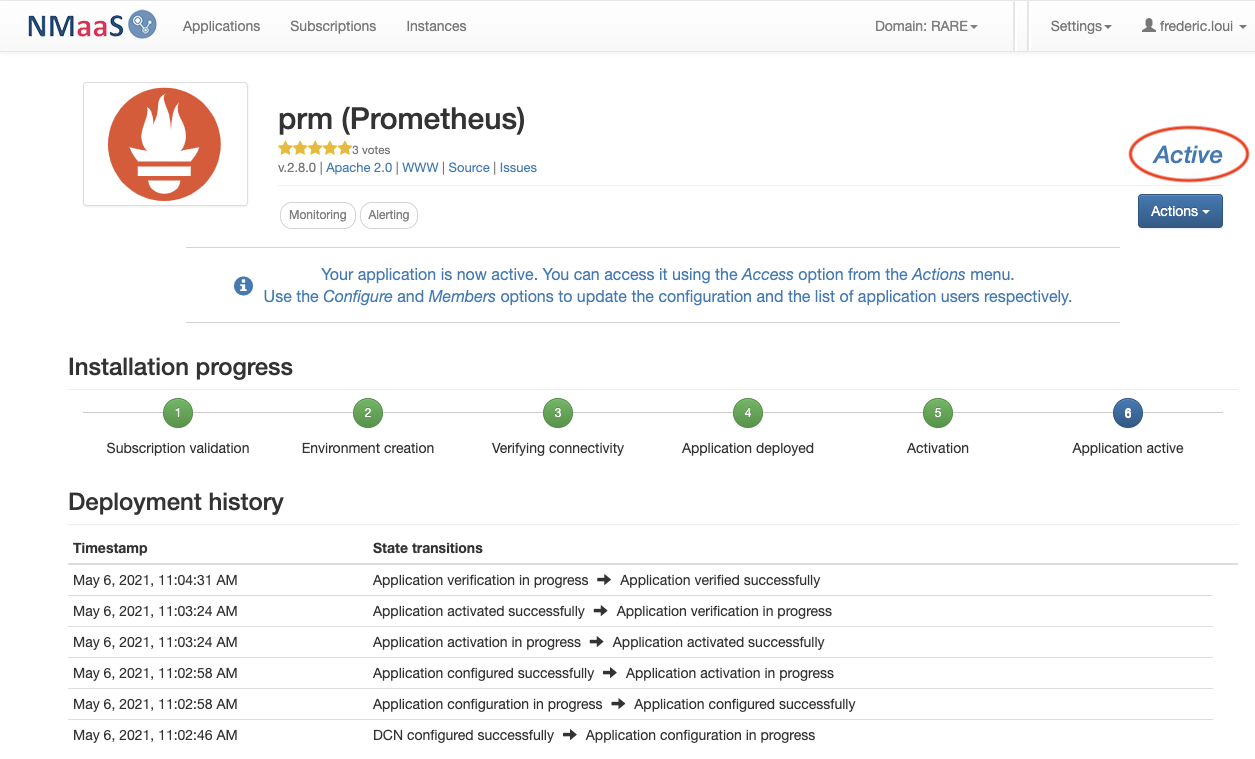
Congratulation. You should have completed Prometheus deployment
Prometheus application specific configuration
In the RARE domain we have specifically configured a Prometheus agent on each P4 switch. In the configuration above we have only configured a dummy IP address.
Subsequent configuration will be done through the usual NMaaS micro-service-configuration workflow using git. (Similar to Oxidized post)
We are using then NMaaS configuration feature (also refer to NMaaS configuration process), which actually will provide us the way to alter Prometheus configuration software.
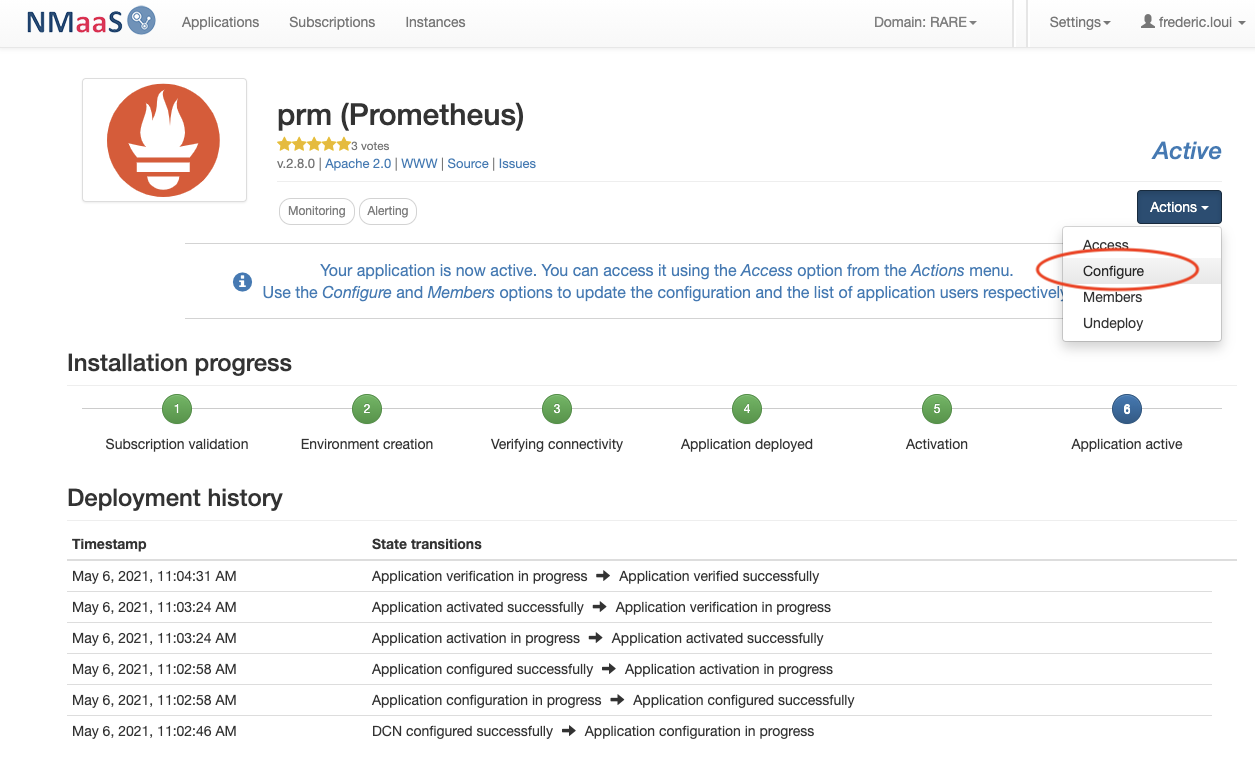
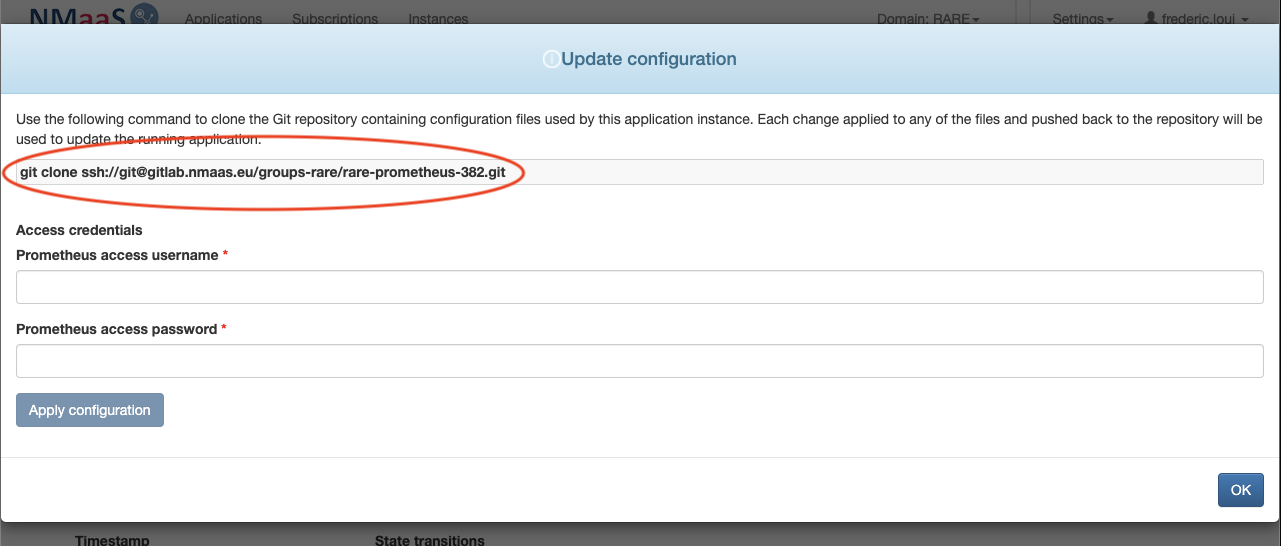
- From the NMaaS portal service instance page select "configuration" entry from the drop-down list
- you should be provided a git command that will let you clone your Prometheus NMaaS configuration repository
| From a terminal, clone oxidized configuration repository | |
|---|---|
| |
- You can now configure prometheus with your target config and adjust it as you see fit
For more information please refer to Prometheus official documentation.
In our case we will use prometheus configuration from the RARE blog post.
| From a terminal, clone oxidized configuration repository | |
|---|---|
Verification
Check that you can access Prometheus using: <svc-name>.<domain>.nmaas.eu
- Access the application
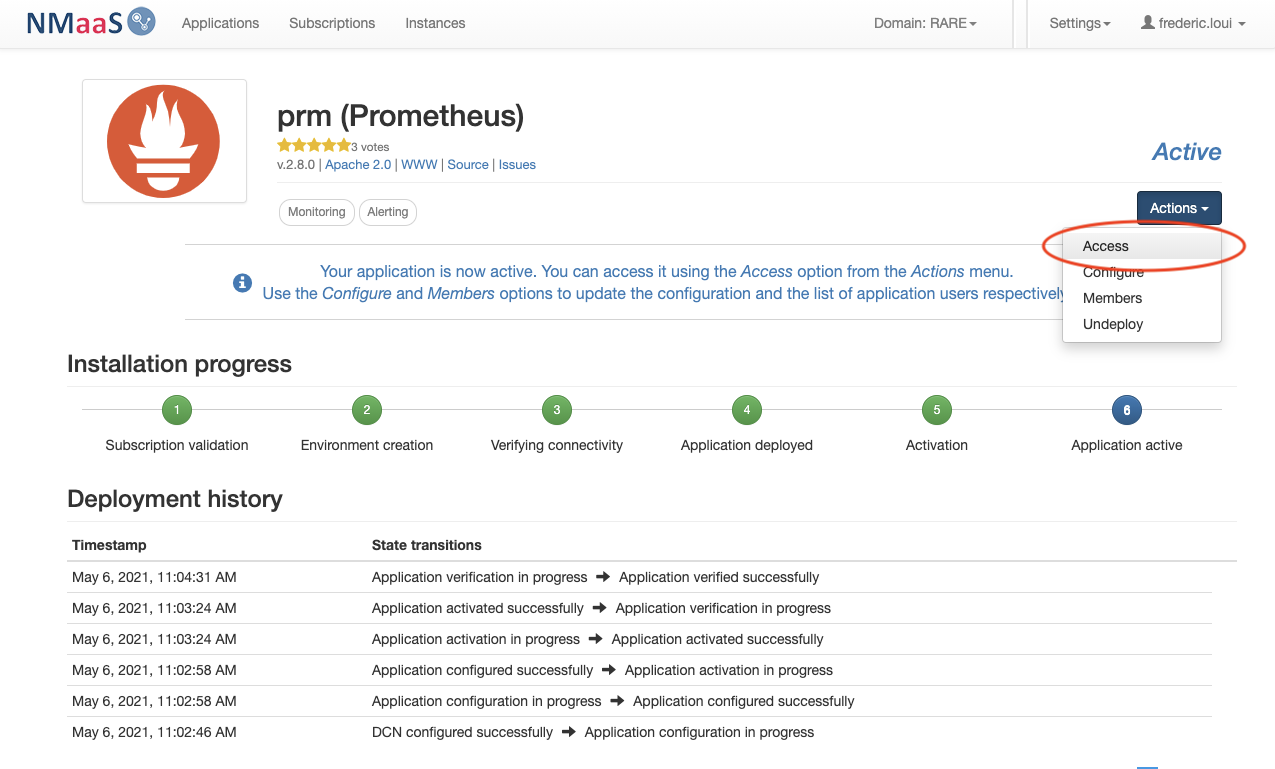
- "Access the application" button shortcut
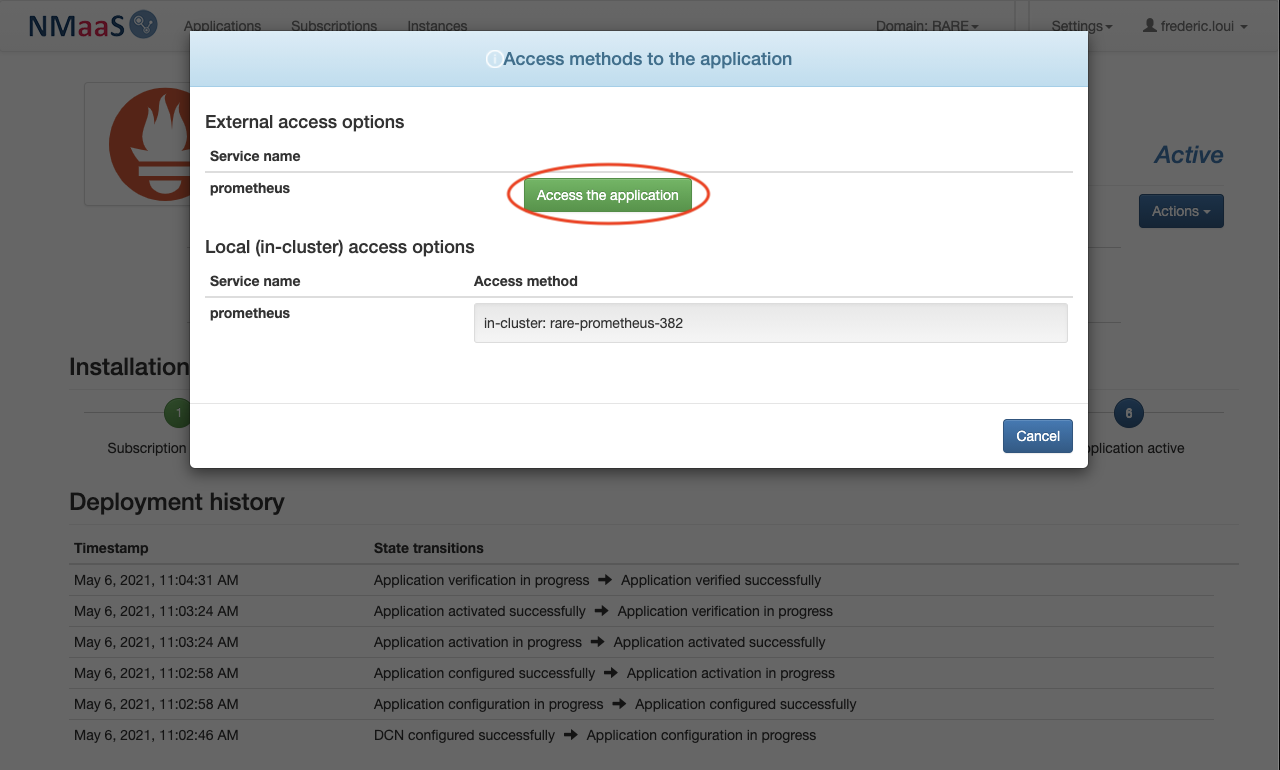
it will lead you to a dynamic FQDN: https://prm.rare.nmaas.eu
You have now access to Prometheus console
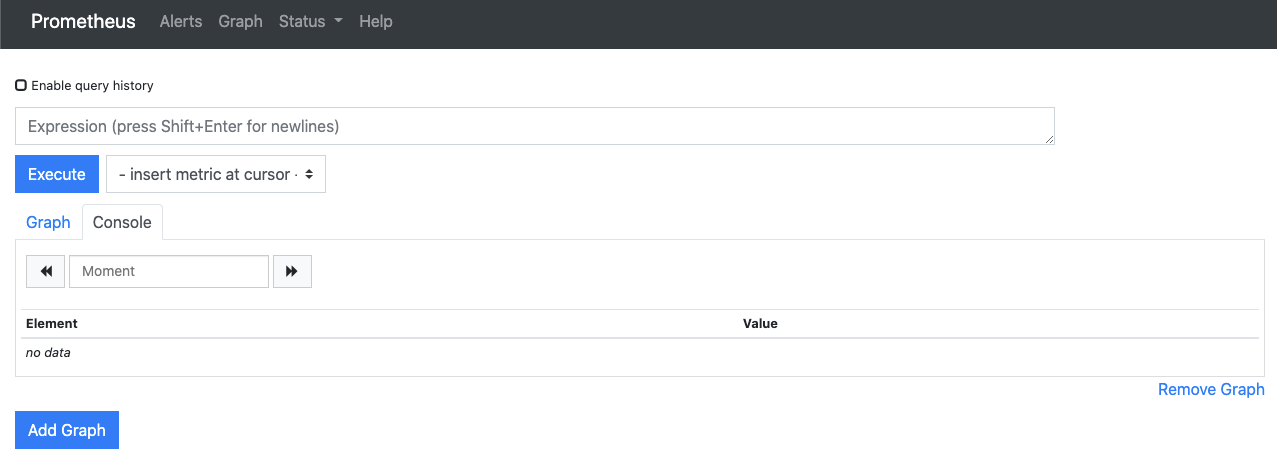
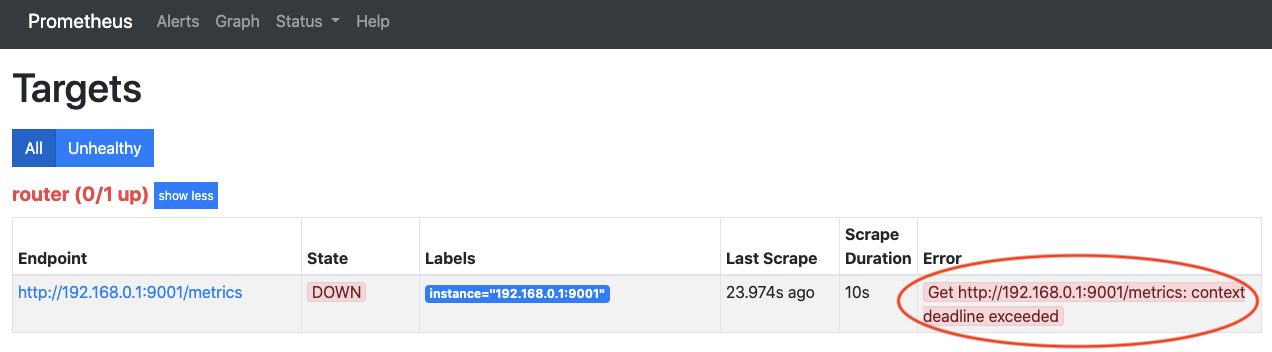
- You can check if the configured agent is reachable
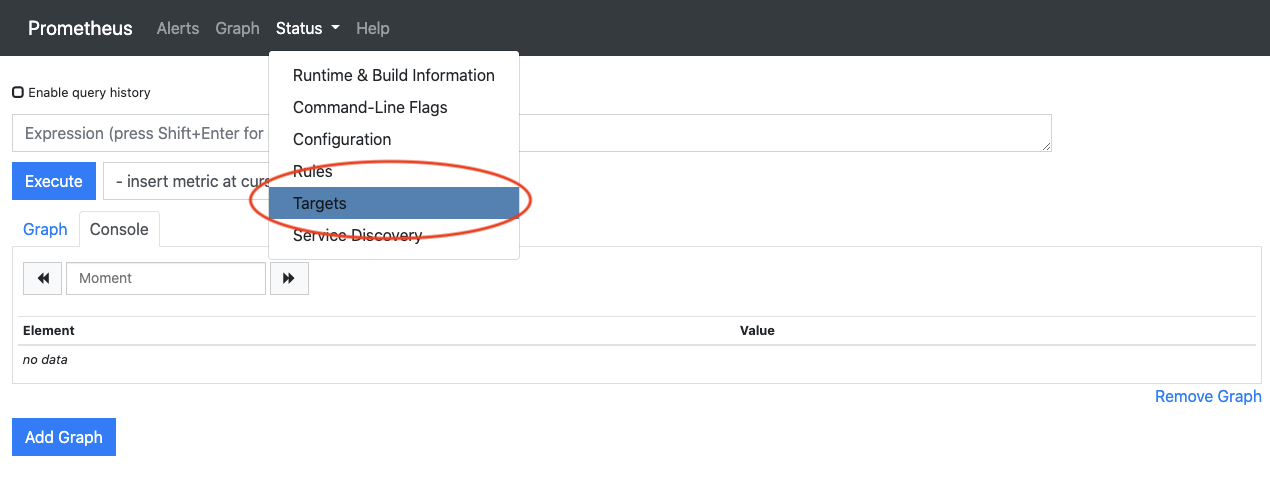
- In this case you have a problem to reach the Prometheus agent. (Check connectivity to the configured Agent 192.168.0.1:9001 in prometheus.yml)
Congratulations! You have deployed and configured your Prometheus NMaaS service specifically for your domain !
Conclusion
In this article you:
- You have deployed a powerful and flexible metric collector for your organisation
- Prometheus uses PUSH model similar to SNMP so every scrape minutes it will interrogate all the configured agents.
- You have learned how to apply specific configurations to it in order to match your requirements
- In this example, we used RARE/freeRtr prometheus agent whose configuration is described here. In your case, you agent will have its own different configuration (different IP, port, job name and metrics )
[ #004 ] NMaaS-101 - key take-away
- Deploying a NMaaS service is as easy as deploying an application on your mobile phone, you just have to log into the NMaaS portal and of course have the sufficient privileges to deploy application for your domain
- Deploying an application is a 2 steps process
- deploy the application via the portal
- configure the application via git tool
- Even if Prometheus deployment by NMaaS is made easy, it is mandatory to have a strong knowledge of the tool implemented. In this case, it is of course essential to read documentation from Prometheus web site.