Grafana
![]()
Grafana is an open source, feature rich metrics dashboard and graph editor for Graphite, Elasticsearch, OpenTSDB, Prometheus and InfluxDB.
Configuration Wizard
Configuration parameters to be provided by the user are explained in the subsections below.
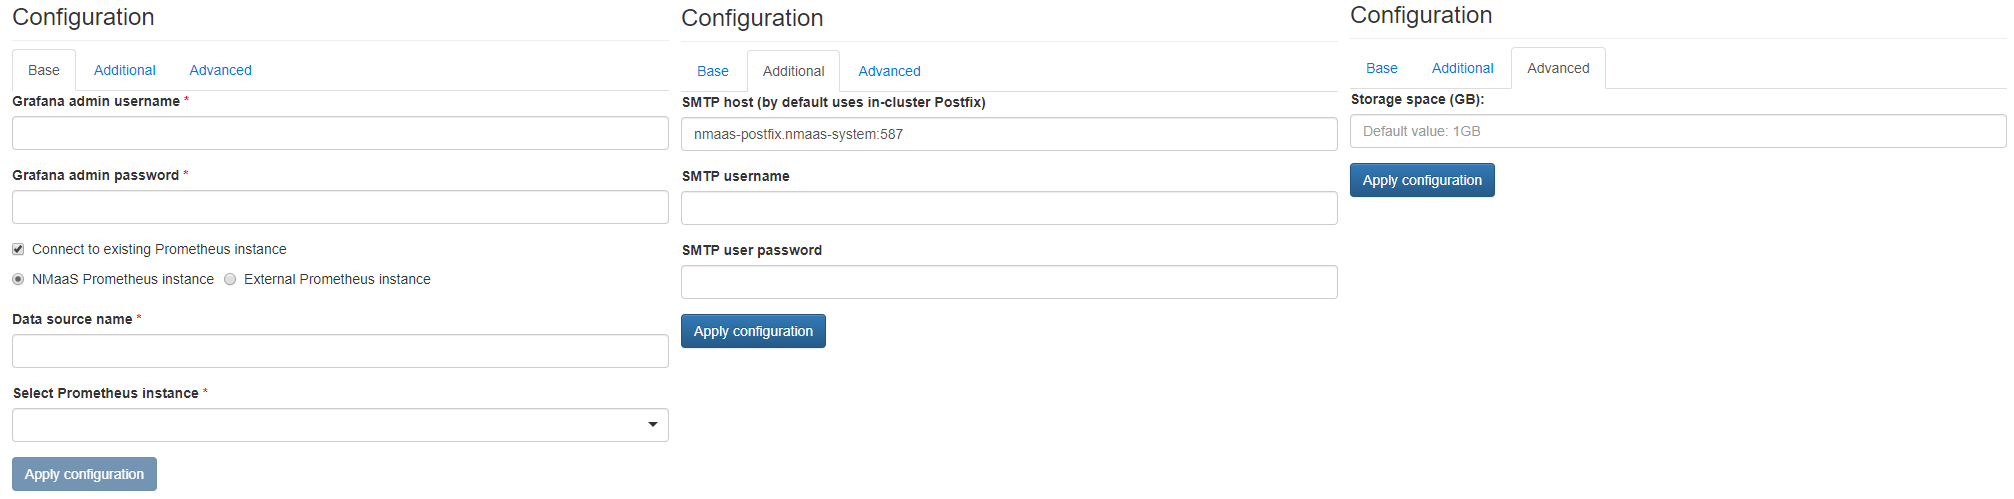
Base tab
Grafana admin username- Username to be used to access the Grafana user interfaceGrafana admin password- Password to be used to access the Grafana user interfaceConnect to existing Prometheus instance[Optional] - If selected, additional fields are displayed allowing to provide information about a Prometheus instance that should be added as a default data source in Grafananmaas Prometheus instance/External Prometheus instance- Switch between the type of Prometheus instance that should be used as the data sourceData source name- The custom data source name that will be assigned to this Prometheus instanceSelect Prometheus instance(if nmaas Prometheus instance is selected) - Pick list allowing to select an instance of Prometheus deployed and already running in the same domain as the Grafana being configuredPrometheus instance address(if External Prometheus instance is selected) - URL of the standalone Prometheus instance to be used
Additional tab
SMTP host[Optional] - The hostname or IP (followed by optional port number) of the SMTP server to be used to send out email notifications. By default it is set to a Postfix instance running locally within the Kubernetes cluster and shared among all the services.SMTP username[Optional] - Username for authorization on the SMTP server (if required)SMTP user password[Optional] - Password for authorization on the SMTP server (if required)
Advanced tab
Storage space (GB)[Optional] - Amount of storage to be allocated to persist data generated by this Grafana instance (default value is displayed in the placeholder, in this case 1 Gigabyte), e.g.1,2or3.